 黑客技术
点击放大
voltron - A hacky debugger UI for hackers
项目说明
=======
![build]()
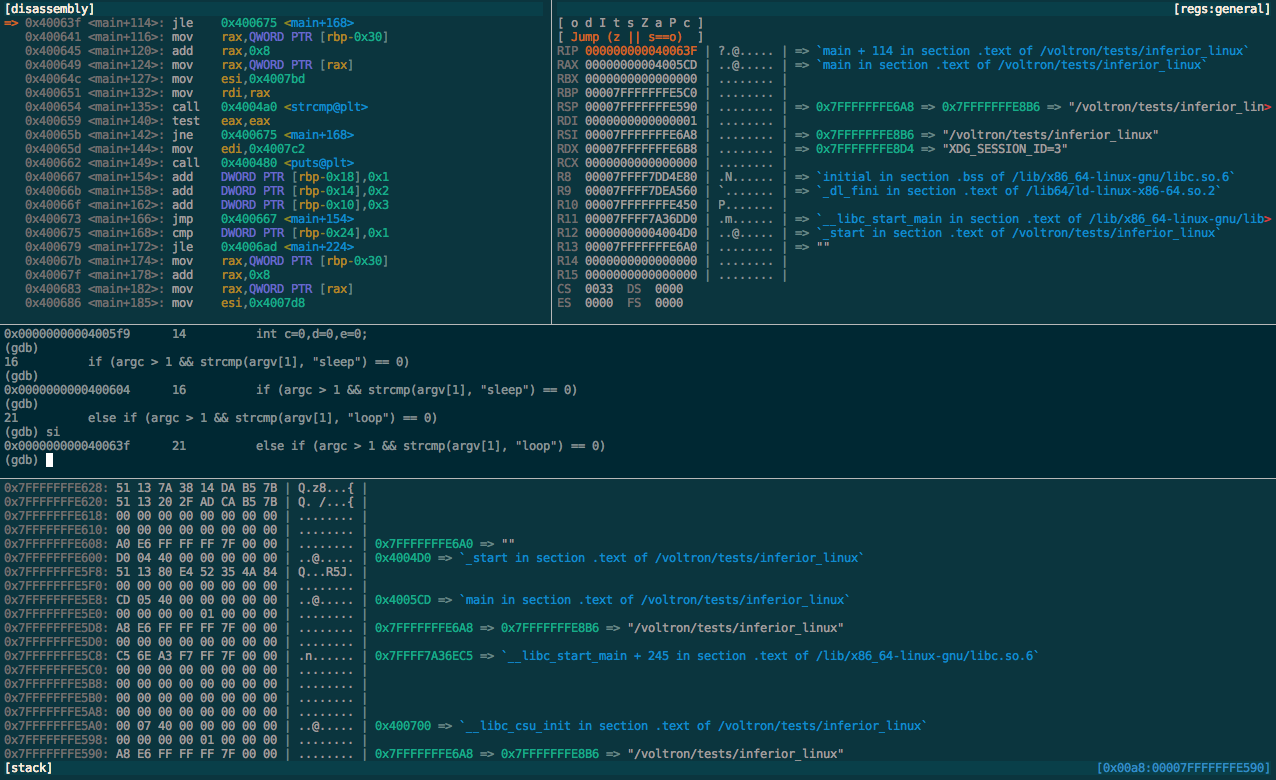
is an extensible debugger UI toolkit written in Python. It aims to improve the user experience of debuggers (LLDB, GDB, VDB and WinDbg) by enabling the attachment of utility views that can retrieve and display data from the debugger host. By running these views in other TTYs, you can build a customised debugger user interface to suit your needs.
does not aim to be e to e. It's not a wholesale replacement for your debugger's CLI. Rather, it aims to complement your existing setup and allow you to extend your CLI debugger as much or as little as you like. If you just want a view of the register contents in a window alongside your debugger, you can do that. If you want to go all out and ha that looks more like OllyDbg, you can do that too.
Built-in views are provided for:
The author's setup looks something like this:
! example LLDB
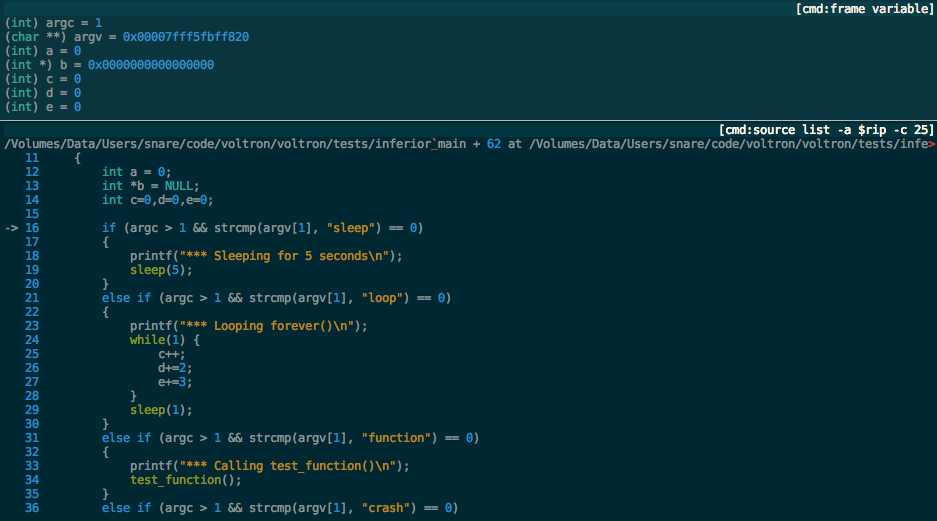
Any debugger command can be split off into a view and highlighted with a specified Pygments lexer:
!command views
More screenshots are here.
Support
-------
supports LLDB, GDB, VDB and WinDbg/CDB (via PyKD) and runs on macOS, Linux and Windows.
WinDbg support is still fairly new, please open an issue if you ha.
The following architectures are supported:
| | lldb | gdb | vdb | windbg |
|---------|------|-----|-----|--------|
| x86 | ✓ | ✓ | ✓ | ✓ |
| x86_64 | ✓ | ✓ | ✓ | ✓ |
| arm | ✓ | ✓ | ✓ | ✗ |
| arm64 | ✓ | ✗ | ✗ | ✗ |
| powerpc | ✗ | ✓ | ✗ | ✗ |
Installation
------------
Note: Only macOS and Debian deri are fully supported by the install script. It should hopefully not fail on other Linux distros, but it won't try to install package dependencies. If you're using another distro, have a look at install.sh to work out what dependencies you might need to install before running it.
Download the 源码 and run the install script:
$ git clone
$ cd
$ ./install.sh
By default, the install script will install into the user's site-packages directory. If you want to install into the system site-packages, use the -s flag:
$ ./install.sh -s
You can also install into a en (for LLDB only) like this:
$ ./install.sh -v /path/to/venv -b lldb
If you are on Windows without a shell, ha installing, or would prefer to install manually, please see the manual installation documentation.
Quick Start
-----------
1. If your debugger has an init script (.lldbinit for LLDB or .gdbinit for GDB) configure it to load when it starts by sourcing the entry.py entry point script. The full path will be inside the package. For example, on macOS it might be */Library/Python/2.7/site-packages//entry.py*. The install.sh script will add this to your .gdbinit or .lldbinit file automatically if it detects GDB or LLDB in your path.
LLDB:
command script import /path/to//entry.py
GDB:
source /path/to//entry.py
2. Start your debugger and initialise manually if necessary.
On recent of LLDB you do not need to initialise manually:
$ lldb target_binary
On older of LLDB you need to call init after you load the inferior:
$ lldb target_binary
(lldb) init
GDB:
$ gdb target_binary
VDB:
$ ./ target_binary
> script /path/to//entry.py
WinDbg/CDB is only supported run via Bash with a Linux userland. The author tests with Git Bash and ConEmu. PyKD and can be loaded in one command when launching the debugger:
$ cdb -c '.load C:\path\to\pykd.pyd ; !py --global C:\path\to\\entry.py' target_binary
3. In another terminal (I use iTerm panes) start one of the UI views. On LLDB, WinDbg and GDB the views will update immediately. On VDB they will not update until the inferior stops (at a breakpoint, after a step, etc):
$ view register
$ view stack
$ view disasm
$ view backtrace
4. Set a breakpoint and run your inferior.
(*db) b main
(*db) run
5. When the debugger hits the breakpoint, the views will be updated to reflect the current state of registers, stack, memory, etc. Views are updated after each command is executed in the debugger CLI, using the debugger's "stop hook" mechanism. So each time you step, or continue and hit a breakpoint, the views will update.
Documentation
-------------
See the wiki on github.
FAQ
---
Q. Why am I getting an ImportError loading ?
A. You might ha of Python installed and ha using the wrong one. See the more detailed installation instructions.
Q. GEF? PEDA? PwnDbg? fG's gdbinit?
A. All super great extensions for GDB. These tools primarily provide sets of additional commands for exploitation tasks, but each also provides a "context" display with a view of registers, stack, 代码, etc, like . These tools print their context display in the debugger console each time the debugger stops. takes a different approach by embedding an RPC ser in the debugger and enabling the attachment of views from other terminals (or even web browsers, or now synchronising with Binary Ninja), which allows the user to build a cleaner multi-window interface to their debugger. works great alongside all of these tools. You can just disable the context display in your GDB extension of choice and hook up some views, while still getting all the benefits of the useful commands added by these tools.
Bugs and Errata
---------------
See the issue tracker on github for more information or to submit issues.
If you're experiencing an ImportError loading , please ensure you' the installation instructions for your platform.
LLDB
On older of LLDB, the init command must be run manually after loading the debug target, as a target must be loaded before 's hooks can be installed. will attempt to automatically register its event handler, and it will inform the user if init is required.
WinDbg
More information about WinDbg/CDB support here.
Misc
The authors primarily use with the most recent of LLDB on macOS. We will try to test e on as many platforms and architectures as possible before releases, but LLDB/macOS/x64 is going to be by far the most frequently-used combination. Hopefully doesn't set your pets on fire, but YMMV.
License
-------
See the LICENSE file.
If you use this and don't hate it, buy me a beer at a conference some time. This license also extends to other contributors - richo definitely deserves a few beers for his contributions.
Credits
-------
Thanks to my former employers Assurance and Azimuth Security for giving me time to spend working on this.
Props to richo for all his contributions to .
fG!'s gdbinit was the original inspiration for this project.
Thanks to Willi for implementing the .
now uses Capstone for disassembly as well as the debugger hosts' internal disassembly mechanism. Capstone is a powerful, open 源码, multi-architecture disassembler upon which the next generation of reverse engineering and debugging tools are being built. Check it out.
Thanks to grazfather for ongoing contributions.
项目信息
开发语言:Python
Star 数:6342
技术要点
该项目属于黑客技术方向的开源资源,代码结构清晰,适合安全研究人员学习参考。项目围绕A hacky debugger UI for hackers展开,提供了可运行的实现,对理解相关安全机制、工具原理与攻防技术具有较高的研究价值。
从技术实现角度看,此类项目的核心在于对底层原理的深入理解与工程化落地。开发者在研究过程中可以结合官方文档与社区讨论,梳理项目的初始化流程、核心模块职责与数据流转,逐步掌握其中的技术细节与设计思路。
使用与学习建议
1. 下载源码压缩包,解压到本地环境。
2. 根据项目类型准备对应的运行环境与依赖。
3. 按照 README 中的步骤完成配置与部署。
4. 在隔离的测试环境中运行验证,避免影响生产系统。
免责声明
本资源来源于开源社区,仅供安全研究、技术学习与合法授权范围内的攻防演练使用,请勿用于任何非法或侵害他人权益的用途。使用本项目产生的一切后果由使用者自行承担。
| 资源标题 | voltron - A hacky debugger UI for hackers |
| 所属分类 | 黑客技术 |
| 发布作者 | admin |
| 发布时间 | 2026-10-05 22:30:18 |
| 下载权限 | 免费下载 |
| 附件数量 | 2 个下载链接 |
| 浏览次数 | 339 |
| 讨论数量 | 0 |
| 主题状态 | 正常讨论中 |