 安全软件
点击放大
beagle - Beagle is an incident response and digital forensi
项目说明
Beagle
![Build Status]() ![codecov]() ![Read The Docs]() ![Docker]() ![PyPI]() ![Slack]()
<!-- "[TOC]" {cmd="toc" depthFrom=2 depthTo=4 orderedList=true} -->
<!-- code_chunk_output -->
1. About Beagle
2. Installation
1. Docker
2. Python Package
3. Configuration
3. Web Interface
1. Uploading Data
2. Browsing Existing Graphs
3. Graph Interface
1. Inspecting Nodes and Edges
2. Expanding Neighbours
3. Hiding Nodes
4. Running Mutators
5. Toggling Node and Edge Types
6. Undo/Redo Action and Reset
7. Graph Perspectives
4. Python Library
1. Controlling Edge Generation
2. Loading Saved JSON
5. Documentation
<!-- /code_chunk_output -->
About Beagle
Beagle is an incident response and digital forensics tool which transforms data sources and logs into graphs. Supported data sources include FireEye HX Triages, Windows E, SysMon logs and Raw Windows memory images. The resulting Graphs can be sent to graph databases such as Neo4J or DGraph, or they can be kept locally as Python NetworkX objects.
Beagle can be used directly as a python library, or through a provided web interface.
<center>
<img src ="docs/imgs/upload_to_graph.gif">
</center>
The library can be used either as a sequence of functional calls from a single datasource.
As a graph generated from a set of multiple artifacts
Or by strictly calling each intermediate step of the data source to graph process.
Graphs are centered around the activity of indi processes, and are meant primarily to help analysts in activity on hosts, not between them.
Installation
Docker
Beagle is a as a docker file:
Python Package
It is also a as library. Full API Documentation is a on
_Note: Only Python 3.6+ is currently supported._
Rekall is not automatically installed. To install Rekall execute the following command instead:
Configuration
Any entry in the configuration file can be modified using en that follow the following format: BEAGLE__{SECTION}__{KEY}. For example, in order to change the API Key used when using the docker image, you would use -e parameter and set the BEAGLE__ :
En and directories can be easily defined using docker compose
Web Interface
Beagle's docker image comes with a web interface that wraps around the process of both transforming data into graphs, as well as using them to in data.
Uploading Data
<center>
<img src ="docs/imgs/web_upload_dropdown.gif">
</center>
The upload form wraps around the graph creation process, and automatically uses NetworkX as the backend. Depending on the parameters required by the data source, the form will either prompt for a file upload, or text input. For example:
Any graph created is stored locally in the folder defined under the dir key from the storage section in the configuration. This can be modified by setting the BEAGLE__STORAGE__DIR en .
Optionally, a comment can be added to any graph to better help describe it.
Each data source will automatically extract metadata from the provided parameter. The metadata and comment are later on when the existing graphs of the datasource.
Browsing Existing Graphs
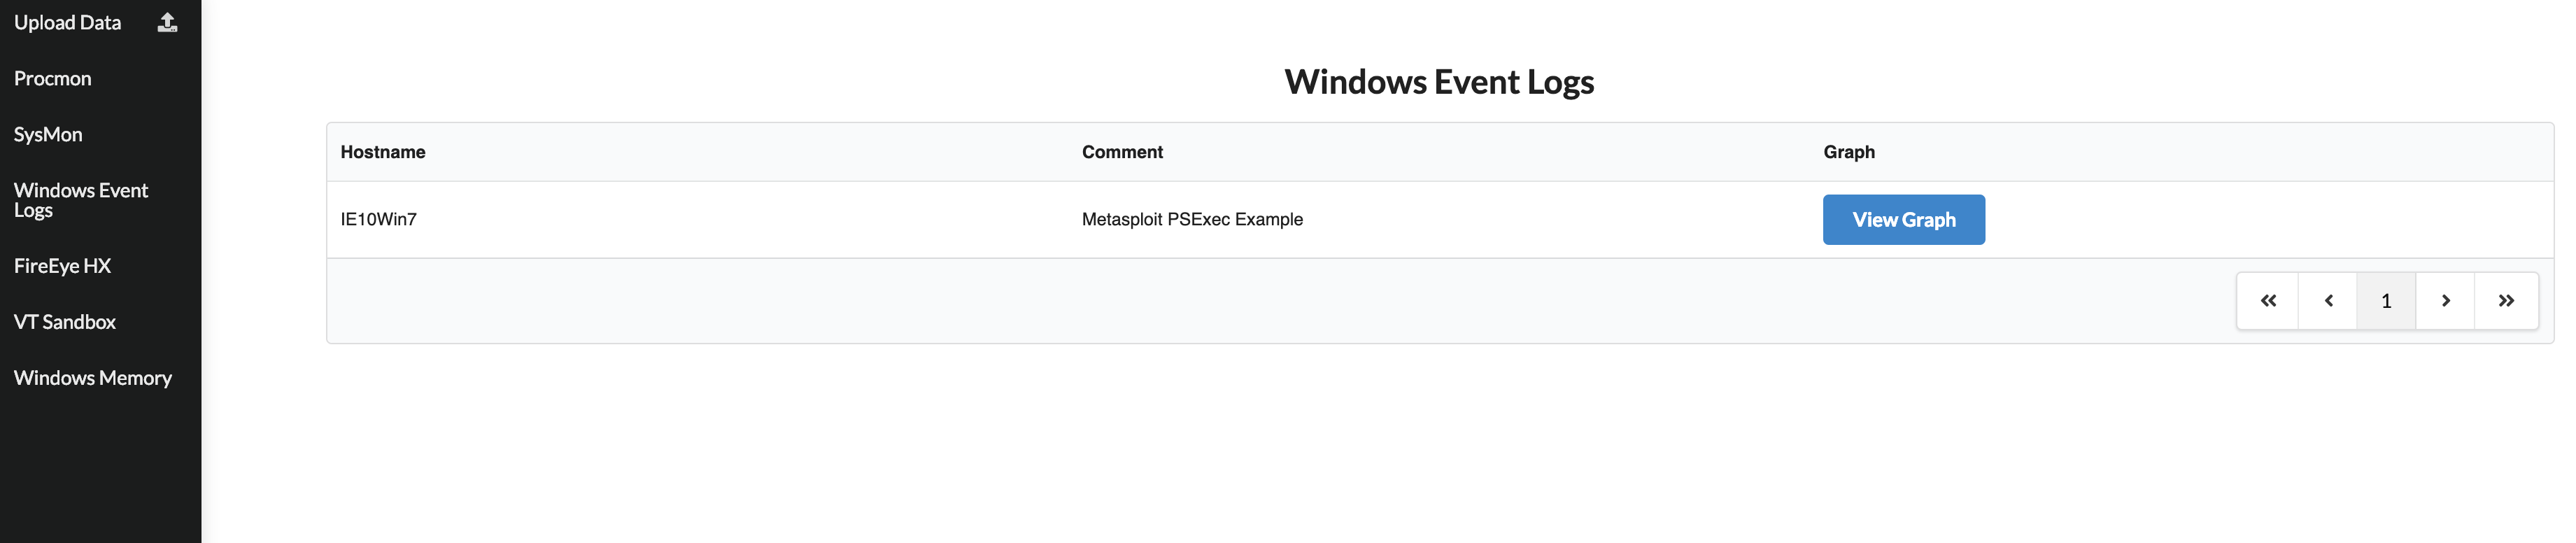
Clicking on a datasource on the sidebar renders a table of all parsed graphs for that datasource.
<center>
<img src="docs/imgs/existing_graphs_page.png">
</center>
Graph Interface
a graph in Beagle provides a web interface that allows analysts to quickly pi an incident.
The interface is split into two main parts, the left part which contains perspectives of the graph (Graph, Tree, Table, etc), and the right part which allows you to filter nodes and edges by type, search for nodes, and expand a node's properties. It also allows you to undo and redo operations you perform on the graph.
Any element in the graph that has a divider above it is collapsible:
<center>
<img src="docs/imgs/collapsable.gif">
</center>
#### Inspecting Nodes and Edges
Nodes in the graph display the first 15 characters of a specific field. For example, for a process node, this will be the process name.
Edges simply show the edge type.
A single click on a node or edge will focus that node and display its information in the "Node Info" panel on the right sidebar.
###### Focusing on a Node
<center>
<img src="docs/imgs/node_select.gif">
</center>
###### Focusing on an Edge
<center>
<img src="docs/imgs/edge_select.gif">
</center>
#### Expanding Neighbours
A double click on a node will pull in any neighbouring nodes. A neighbouring node is any node connected to the clicked-on node by an edge. If there are no neighbors to be pulled in, no change will be seen in the graph.
<center>
<img src="docs/imgs/double_click_neighbours.gif">
</center>
#### Hiding Nodes
A long single click on a node will hide it from the graph, as well as any edges that depend on it.
<center>
<img src="docs/imgs/hiding_node.gif">
</center>
#### Running Mutators
Right clicking on a node exposes a context menu that allows you to run graph mutators. Mutators are functions which take the graph state, and return a new state.
Two extremely useful mutators are:
1. Backtracking a node: Find the sequence of nodes and edges that led to the creation of this node.
- Backtracking a process node will show its process tree.
2. Expanding all descendants: From the current node, show every node that has this node as an ancestor.
- Expanding a process node will show every child process node it spawned, any file it may ha, and pretty much every activity that happened as a result of this node.
###### Backtracking a node
Backtracking a node is extremely useful and is similar to doing a root cause infection in log files.
<center>
<img src="docs/imgs/backtrack_node.gif">
</center>
###### Expanding Node Descendants
Expanding a node's descendants allows you to immediately view e that happened because of this node. This action reveals the subgraph rooted at the selected node.
<center>
<img src="docs/imgs/expand_descendants_node.gif">
</center>
#### Toggling Node and Edge Types
Sometimes, a Node or Edge might not be relevant to the current incident, you can toggle edge and node types on and off. As soon as the type is toggled, the nodes or edges of that type are removed from the graph.
Toggling a node type off prevents that node type to be used when using mutators, or when pulling in neighbours.
<center>
<img src="docs/imgs/toggle_types.gif">
</center>
#### Undo/Redo Action and Reset
Any action in the graph is immediately re! Using the undo/redo buttons you can revert any action you perform. The reset button sets the graph state to when it loaded, saving you a refresh.
<center>
<img src="docs/imgs/redo_undo.gif">
</center>
#### Graph Perspectives
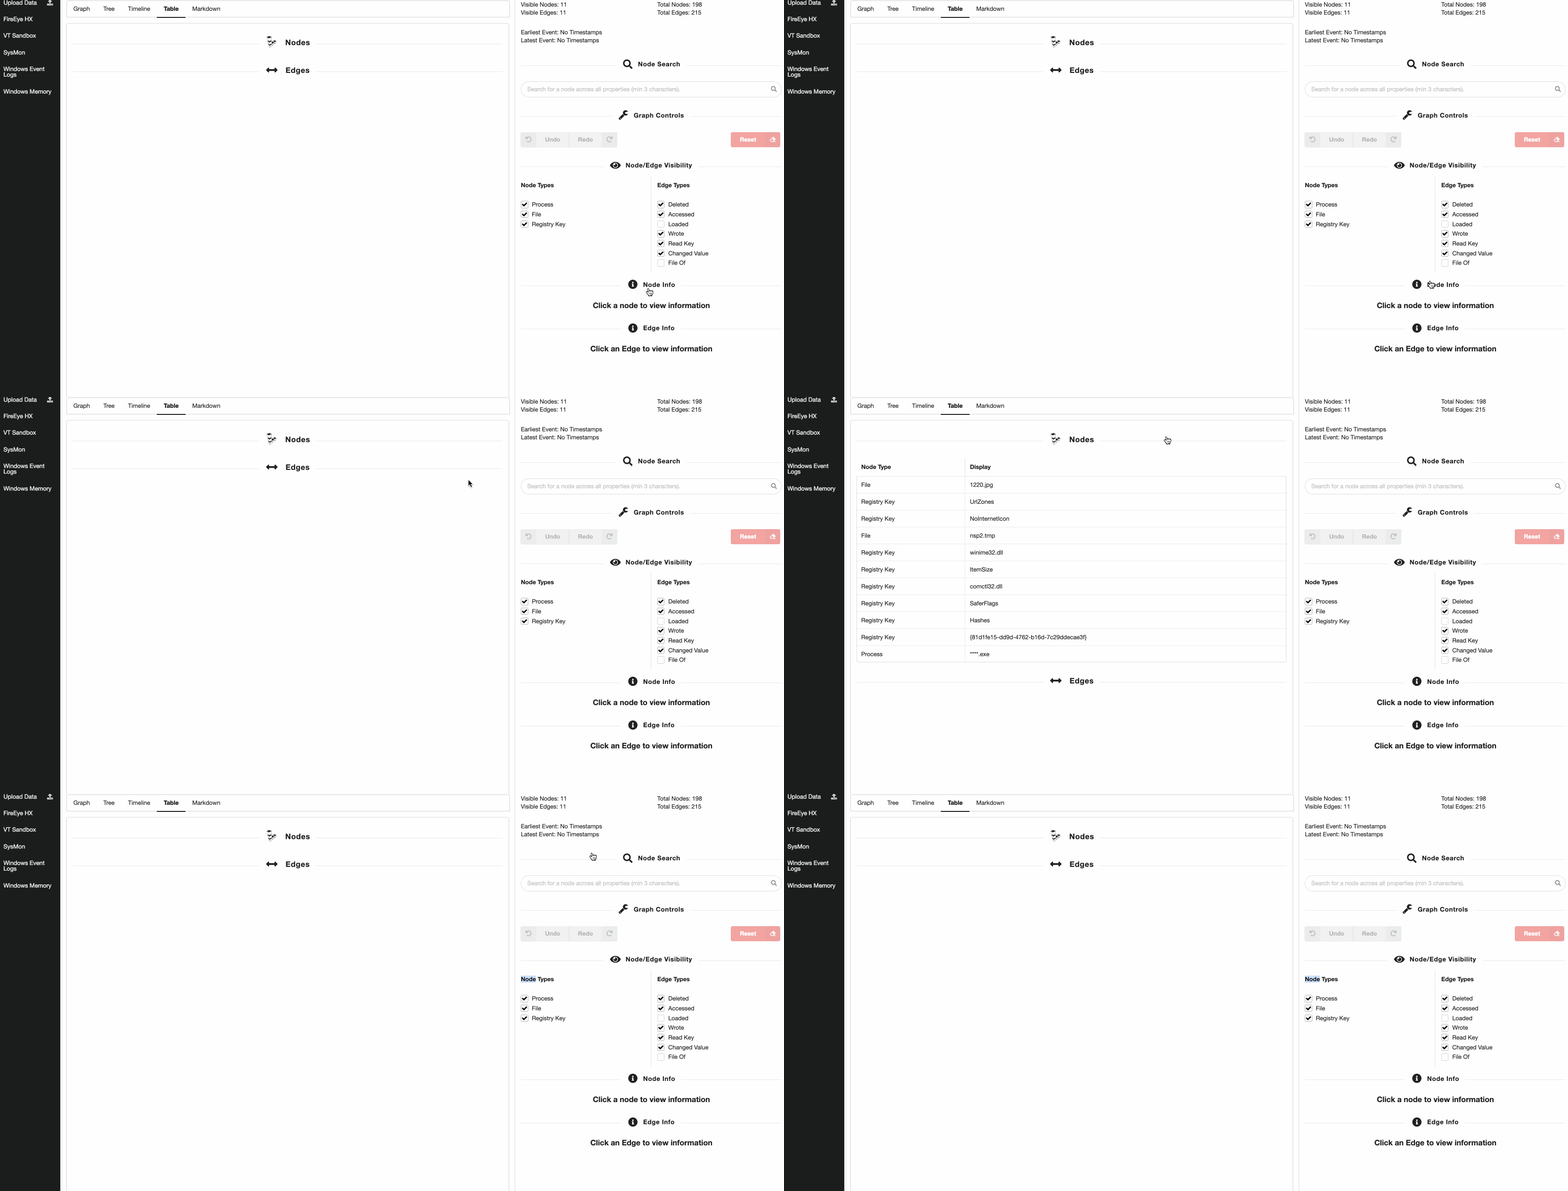
As you change the graph's current state using the abo, you might also want to view the current set of node and edges in a different perspective. The tabs at the top of the graph screen allow you to transform the data into a of views:
Each of the perspecti focusing on nodes by clicking on them.
<center>
<img src="docs/imgs/perspectives.gif">
</center>
Python Library
The graph generation process can be performed programmatically using the python library. The graph generation process is made up of three steps:
1. DataSource classes parse and yield events one by one.
2. Transformer classes take those inputs and transform them into Node classes such as Process.
3. Backend classes take the array of nodes, place them into a graph structure, and send them to a desired location.
The Python package can be installed via pip:
Creating a graph requires chaining these together. This can be done for you using the to_graph() function.
It can also be done explicitly at each step. Using the functional calls, you can also define which Backend you wish to use for example, to send data to DGraph
When calling the to_graph or to_transformer methods, you can pass in any arguments to those classes:
You can also manually invoke each step in the abo, accessing the intermediary outputs
If you want to manually call each step, you will need to ensure that the Transformer class instance is compatible with the output of the provided DataSource class.
Each data source defines the list of transformers it is compatible with, and this can be accessed via the .transformers attribute:
Controlling Edge Generation
By default, edges are not condensed, that means that if a process node u writes to a file node v 5000 times, you will have 5000 edges between those nodes. Sometimes, especially when trying to the data, this may o an analyst.
You can condense all 5000 edges into a single edge for that type of action (wrote in this case), by passing the backend class the consolidate_edges=True parameter, for example:
By default, the web interface will consolidate the edges.
Loading Saved JSON
Using the NetworkX backend allows you to save the resulting graph as a JSON object, saving it for later. You can use the NetworkX.from_json static method to load it back in.
Documentation
项目信息
开发语言:Python
Star 数:1355
技术要点
该项目属于安全软件方向的开源资源,代码结构清晰,适合安全研究人员学习参考。项目围绕Beagle is an incident response and digital forensics tool which transforms security logs and data into graphs.展开,提供了可运行的实现,对理解相关安全机制、工具原理与攻防技术具有较高的研究价值。
从技术实现角度看,此类项目的核心在于对底层原理的深入理解与工程化落地。开发者在研究过程中可以结合官方文档与社区讨论,梳理项目的初始化流程、核心模块职责与数据流转,逐步掌握其中的技术细节与设计思路。
使用与学习建议
1. 下载源码压缩包,解压到本地环境。
2. 根据项目类型准备对应的运行环境与依赖。
3. 按照 README 中的步骤完成配置与部署。
4. 在隔离的测试环境中运行验证,避免影响生产系统。
免责声明
本资源来源于开源社区,仅供安全研究、技术学习与合法授权范围内的攻防演练使用,请勿用于任何非法或侵害他人权益的用途。使用本项目产生的一切后果由使用者自行承担。
| 资源标题 | beagle - Beagle is an incident response and digital forensi |
| 所属分类 | 安全软件 |
| 发布作者 | admin |
| 发布时间 | 2026-10-05 22:31:29 |
| 下载权限 | 免费下载 |
| 附件数量 | 2 个下载链接 |
| 浏览次数 | 324 |
| 讨论数量 | 0 |
| 主题状态 | 正常讨论中 |