 病毒分析
点击放大
DotDumper - An automatic unpacker and logger for DotNet Framew
项目说明
<img src="images/DotDumper.png" alt="The DotDumper logo, a dumping truck" width="610" height="414" />
DotDumper
An automatic unpacker and logger for DotNet Framework targeting files! This tool has been un at Black Hat USA 2022. At Black Hat Asia 2023, DotDumperGUI and DotDumperNative were published, along with 1.1-stable of DotDumper. These three tools are meant to be used together, where DotDumper 1.1-stable requires DotDumperNative's DLLs to be present, while DotDumperGUI is meant as a graphical user-interface to open and filter the JSON output from DotDumper runs.
The automatic detection and classification of any given file in a reliable manner is often considered the holy grail of malware analysis. The trials and tribulations to get there are plenty, which is why the creation of such a system is held in high regard. When it comes to DotNet targeting binaries, our new open-source tool DotDumper aims to assist in several of the crucial steps along the way: logging (in-memory) activity, dumping interesting memory segments, and extracting characteristics from the gi.
Table of contents
* <a href="#why_dotdumper">Why DotDumper?</a>
* <a href="#features">Features</a>
* <a href="#cli">Using the command-line interface</a>
* <a href="#logging_and_dumping">Logging and dumping</a>
* <a href="#reflection">Reflection</a>
* <a href="#hooks">(Un)managed hooks</a>
* <a href="#extendible">Easily extendible</a>
* <a href="#sandbox">Sandbox timeout support</a>
* <a href="#differences">Differences with known tooling</a>
* <a href="#future_work">Future work</a>
<a name="why_dotdumper">Why DotDumper?</a>
In brief, manual unpacking is a tedious process which consumes a disproportional amount of time for analysts. Obfuscated binaries further increase the time an analyst must spend to unpack a given file. When scaling this, organizations need numerous analysts who dissect malware daily, likely in combination with a scalable sandbox. The lost time could be used to dig into interesting campaigns or samples to uncover new threats, rather than the mundane generic malware that is widely spread. Afterall, analysts look for the few needles in the haystack.
So, what difference does DotDumper make? Running a DotNet based malware sample provides log files of crucial, contextualizing, and common function calls in three formats (human readable plaintext, JSON, and XML), as well as copies from useful in-memory segments. As such, an analyst can skim through the function call log. Additionally, the dumped files can be scanned to classify them, pro additional insight into the malware sample and the data it contains. This cuts down on time vital to the triage and incident response processes, and frees up SOC analyst and researcher time for more sophisticated analysis needs.
<a name="features">Features</a>
To log and dump the contextualizing function calls and their results, DotDumper uses a mixture of reflection and managed hooks, all written in pure C#. Below, key features will be highlighted and elaborated upon, in combination with excerpts of DotDumper’s results of a packed AgentTesla stealer sample, the hashes of which are below.
|Hash type | Hash value |
| --- | ----------- |
| SHA-256 | b7512e6b8e9517024afdecc9e97121319e7dad2539eb21ae5558d |
| SHA-1 | c10e48ee1f802f730f41f3d11ae9d7bcc649080c |
| MD-5 | 23541daadb154f1f59119952e7232d6b |
<a name="cli">Using the command-line interface</a>
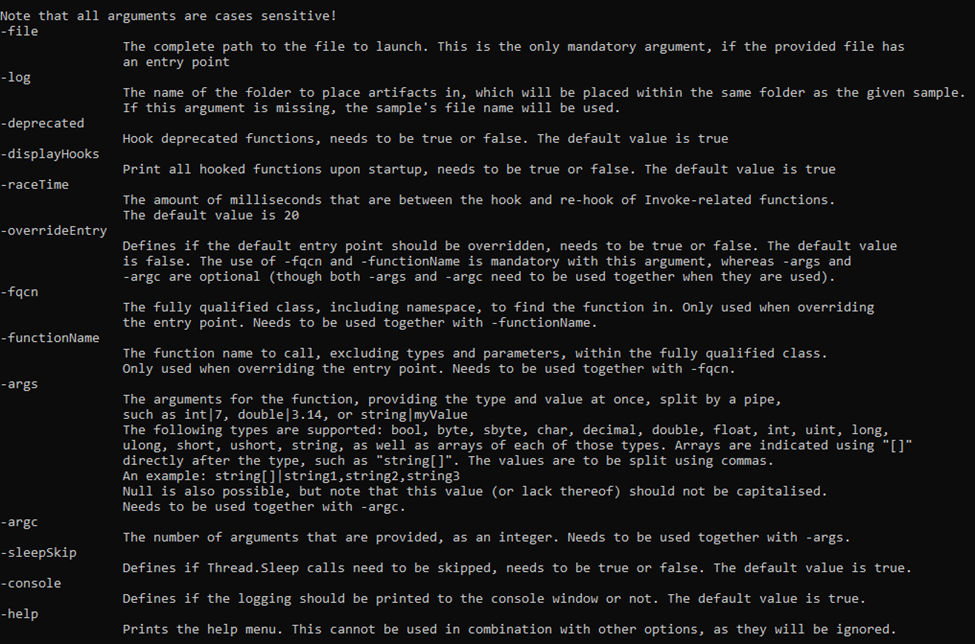
DotDumper is accessible through a command-line interface, with a of arguments. The image below shows the help menu. Note that not all arguments will be discussed, but rather the most used ones.
!DotDumper's command-line interface menu
The minimal requirement to run a gi, is to provide the “-file” argument, along with a file name or file path. If a full path is given, it is used. If a file name is given, the current working directory is checked, as well as the folder of DotDumper’s executable location.
Unless a directory name is provided, the “-log” folder name is set equal to the file name of the sample without the extension (if any). The folder is located in the same folder as DotDumper resides in, which is where the logs and dumped files will be saved in.
In the case of a library, or an alternati point into a binary, one must o the entry point using “-o true”. Additionally, one has to provide the fully qualified class, which includes the name space using “-fqcn My.NameSpace.MyClass”. This tells DotDumper which class to select, which is where the provided function name (using “-functionName MyFunction”) is retrieved.
If the selected function requires arguments, one has to provide the number of arguments using “-argc” and the number of required arguments. The argument types and are to be provided as “string|myValue int|9”. Note that when spaces are used in the , the argument on the command-line interface needs to be encapsulated between quotes to ensure it is passed as a single argument.
Other less frequently used options such as “-raceTime” or “-deprecated” are safe in their default settings but might require tweaking in the future due to changes in the DotNet Framework. They are currently exposed in the command-line interface to easily allow changes, if need be, even if one is using an older of DotDumper when the time comes.
<a name="logging_and_dumping">Logging and dumping</a>
Logging and dumping are the two core features of DotDumper. To minimize the amount of time the analysis takes, the logging should provide context to the analyst. This is done by pro the analyst with the following information for each logged function call:
* A stack trace based on the function’s caller
* Information regarding the assembly object where the call originated from, such as the name, , and cryptographic hashes
* The parent assembly, from which the call originates if it is not the original sample
* The type, name, and value of the function’s arguments
* The type, name, and value of function’s return value, if any
* A list of files which are dumped to disk which correspond with the gi call
Note that for each dumped file, the file name is equal to the file’s SHA-256 hash.
To clarify the above, an excerpt of a log is gi. The excerpt shows the details for the aforementioned AgentTesla sample, where it loads the second stage using DotNet’s Assembly.Load function.

First, the local system time is given, together with the original function’s return type, name, and argument(s). Second, the stack trace is given, where it shows that the sample’s main function leads to a constructor, initialises the components, and calls two custom functions. The Assembly.Load function was called from within “Na.TaskEightBestOil.GGGGGGGGGGGGGGGGGGGG(String str)”. This provides context for the analyst to find the code around this call if it is of interest.
Then, information regarding the assembly call order is given. The more stages are loaded, the more complex it becomes to see stages the call came to be. One normally expects one stage to load the next, but in some cases later stages utilize previous stages in a non-linear order. Additionally, information regarding the originating assembly is given to further enrich the data for the analyst.
Next, the parent hash is given. The parent of a stage is the previous stage, which in this example is not yet present. The newly loaded stage will have this stage as its parent. This allows the analyst to correlate events more easily.
Finally, the function’s return type and value are stored, along with the type, name, and value of each argument that is passed to the hooked function. If any is larger than 100 bytes in size, it is stored on the disk instead. A reference is then inserted in the log to reference the file, rather than showing the value. The threshold has been set to avoid hiccups in the printing of the log, as some arrays are thousands of indices in size.
<a name="reflection">Reflection</a>
Per Microsoft’s documentation, reflection is best summarized) as “[…] provides objects that encapsulate assemblies, modules, and types”. In short, this allows the dynamic creation and in of DotNet classes and functions from the malware sample. DotDumper contains a reflecti which allows an analyst to load and analyze both executables and libraries, as long as they are DotNet Framework based.
To utilize the loader, one has to opt to o the entry point in the command-line interface, specify the class (including the namespace it resides in) and function name within a given file. Optionally, one can provide arguments to the specified function, for all nati and arrays thereof. Examples of nati are int, string, char, and arrays such as int[], string[], and char[]. All the arguments are to be provided via the command-line interface, where both the type and the value are to be specified.
Not o the entry point results in the default entry point being used. By default, an empty string array is passed towards the sample’s main function, as if the sample is executed without arguments.
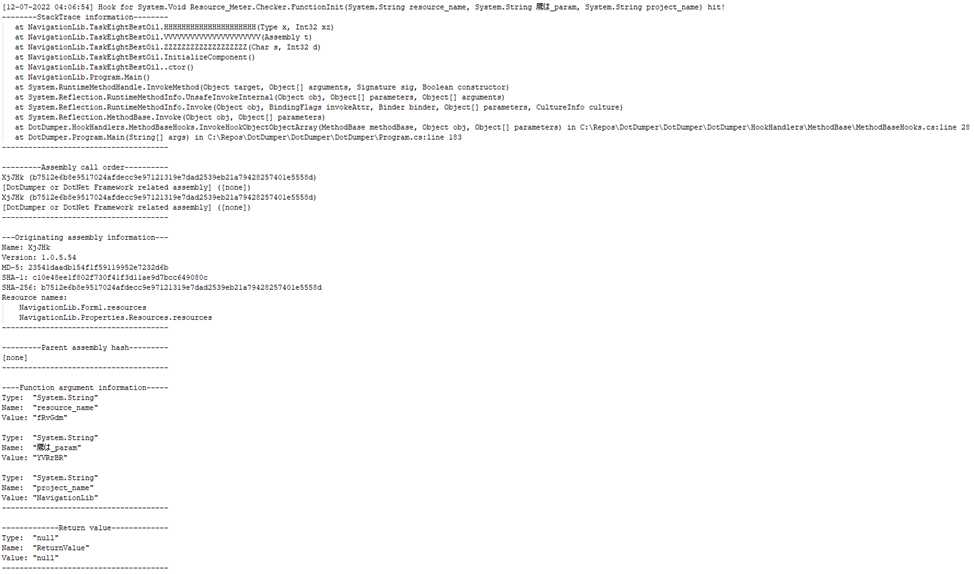
Additionally, reflection is often used by loaders to invoke a gi in a gi in the next stage. Sometimes, arguments are passed along as well, which are used later to decrypt a resource. In the aforementioned AgentTesla sample, this exact scenario plays out. DotDumper’s invoke related hooks log these occurrences, as can be seen below.
!The intercepted hook to invoke the second stage
The function name in the first line is not an internal function of the DotNet Framework, but rather a call to a specific function in the second stage. The types and names of the three arguments are listed in the function signature. Their can be found in the function argument information section. This would allow an analyst to load the second stage in a custom loader with the gi for the arguments, or even do this using DotDumper by loading the pre dumped stage and pro the arguments.
<a name="hooks">(Un)managed hooks</a>
Before going into managed hooks, one needs to understand how hooks work. There are two main to consider here: the target function and a controlled function which is referred to as the hook. Simply put, the memory at the target function (i.e. Assembly.Load) is altered to instead to jump to the hook. As such, the program’s execution flow is di. The hook can then perform arbitrary actions, optionally call the original function, after which it returns the execution to the caller together with a return value if need be. The diagram below illustrates this process.
!The flow chart of a hook's installation and usage
Knowing what hooks are is essential to understand what managed hooks are. Managed code is executed in a and managed en, such as the DotNet runtime or Java’s machine. Obtaining the memory address where the managed function resides differs from an unmanaged language such as C. Once the correct memory addresses for both functions have been obtained, the hook can be set by directly accessing memory using unsafe C#, along with DotNet’s interoperability service to call nati API functionality.
Since DotDumper v1.1-stable, DotDumper can also hook unmanaged (or native, if you will) functions. The function redirection can be any combination from-and-to managed and unmanaged functions, with one important caveat. Any unmanaged function that uses a managed hook, will not be able to properly read the stack's . As such, a nati is required (dubbed DotDumperNative). This component communicates via a named pipe with DotDumper itself, thus using its centralised logging system, while intercepting unmanaged calls with access to the function arguments found on the stack.
<a name="extendible">Easily extendible</a>
Since DotDumper is written in pure C# without any external dependencies, one can easily extend the framework using Studio. The code is documented in this blog, on GitHub, and in classes, in functions, and in-line in the source code. This, in combination with the clear naming scheme, allows anyone to modify the tool as they see fit, minimizing the time and effort that one needs to spend to understand the tool. Instead, it allows de and analysts alike to focus their efforts on the tool’s impro.
<a name="sandbox">Sandbox timeout support</a>
While the sandbox timeout support feature hasn’t been changed nor modified, it wasn’t documented before. Since DotDumper executes the file it is given, its execution will continue until the sample terminates. Malware often enters a “waiting” state, where a certain condition must be met before it reactivates, or the malware continues execution in a different process (with the help of process injection). For example, a newly created thread in a hollowed process only returns once it is finished.
To avoid stalling, DotDumper has a stagnation handler. Each time a hook’s results are logged, a counter is incremented. If this counter is unchanged after three consecuti intervals, DotDumper assumes a stagnated state is encountered. In that case, the system’s time is set to 30-12-2200 12:00 to force the sandbox to time out, after which it notifies the analyst via the logger and terminates itself. The sandbox timeout occurs when the elapsed time from the current date until the newly set date exceeds the usual 5 or 10 minutes. Even if the sandbox runtime is set to hours or days, it is exceeded.
The reason to cut the analysis short is to save time and resources, since a submission with a 10-minute timeout might only take 2 minutes to run. As such, one would be able to run multiple samples in the same time span with the stagnation handler. An o of the stagnation handler’s logic is shown below.
!The flow chart of the stagnation handler
<a name="differences">Differences with known tooling</a>
With the goal and features of DotDumper clear, it might seem as if there’s o with known publicly a tools such as ILSpy, dnSpyEx, de4dot, or pe-sieve. Note that there is no intention to proclaim one tool is better than another, but rather how the tools differ.
DotDumper’s goal is to log and dump crucial, contextualizing, and common function calls from DotNet targeting samples. ILSpy is a DotNet disassembler and decompiler, but does not allow the execution of the file. dnSpyEx (and its predecessor dnSpy) utilise ILSpy as the disassembler and decompiler component, while adding a debugger. This allows one to manually inspect and manipulate memory. de4dot is solely used to deobfuscate DotNet binaries, improving the code’s readability for human eyes. The last tool in this comparison, pe-sieve, is meant to detect and dump malware from running processes, disregarding the used programming language. The table below provides a graphical o of the abo tools.
!The table with the different tool purposes in summary
<a name="future_work">Future work</a>
DotDumper is under constant review and de, all of which is focused on two main areas of interest: bug fixing and the addition of new features. During the de, the code was tested, but due to injection of hooks into the DotNet Framework’s functions which can be subject to change, it’s very well possible that there are bugs in the code. Anyone who encounters a bug is urged to open an issue on the GitHub repository, which will then be looked at. The suggestion of new features is also possible via the GitHub repository. For those with a GitHub account, or for those who rather not publicly interact, feel free to send me a private message on my Twitter.
Needless to say, if you've used DotDumper during an analysis, or used it in a creative way, feel free to reach out in public or in private! There’s nothing like hearing about the usage of a home-made tool!
There is more in store for DotDumper, and an update will be sent out to the community once it is a!
项目信息
开发语言:C#
Star 数:264
技术要点
该项目属于病毒分析方向的开源资源,代码结构清晰,适合安全研究人员学习参考。项目围绕An automatic unpacker and logger for DotNet Framework targeting files展开,提供了可运行的实现,对理解相关安全机制、工具原理与攻防技术具有较高的研究价值。
从技术实现角度看,此类项目的核心在于对底层原理的深入理解与工程化落地。开发者在研究过程中可以结合官方文档与社区讨论,梳理项目的初始化流程、核心模块职责与数据流转,逐步掌握其中的技术细节与设计思路。
使用与学习建议
1. 下载源码压缩包,解压到本地环境。
2. 根据项目类型准备对应的运行环境与依赖。
3. 按照 README 中的步骤完成配置与部署。
4. 在隔离的测试环境中运行验证,避免影响生产系统。
免责声明
本资源来源于开源社区,仅供安全研究、技术学习与合法授权范围内的攻防演练使用,请勿用于任何非法或侵害他人权益的用途。使用本项目产生的一切后果由使用者自行承担。
| 资源标题 | DotDumper - An automatic unpacker and logger for DotNet Framew |
| 所属分类 | 病毒分析 |
| 发布作者 | admin |
| 发布时间 | 2026-10-05 23:25:06 |
| 下载权限 | 免费下载 |
| 附件数量 | 2 个下载链接 |
| 浏览次数 | 127 |
| 讨论数量 | 0 |
| 主题状态 | 正常讨论中 |